A competitor price analysis turns comparable offer data into a reasoned pricing decision. Define the purchase scenario, normalize the figures, calculate gaps against a named reference, then separate observations from explanations you still need to test. The output is a decision brief, not simply a list of cheaper sellers.
This guide works through a fictional US apparel example, with dollar amounts compared before sales tax. It focuses on interpreting a small dataset, not choosing monitoring software. The same reasoning can support a broader competitive analysis, but prices alone cannot explain a competitor's market share, profitability or customers' preferences.
THE WORKFLOW
Decision question → comparison group → normalized table → price gaps → interpretation → action to evaluate.
01. Start with a pricing question you can answer
“What are our competitors doing?” is too broad for a useful calculation. Ask something specific: “Is our delivered price higher for these two items when a customer buys one at a time?” Define the customer, destination, order contents and observation period before looking at the outcome.
Competitive analysis can also cover product value, service, positioning and customer perceptions. This example isolates price and shipping rather than claiming to assess the whole business. Shopify's competitive pricing guide connects price comparisons with product value and internal costs. Your own question determines which comparisons are relevant.
WORKED EXAMPLE — ALL DATA IS FICTIONAL
Example Apparel is considering a pricing change for a T-shirt and a sweatshirt. A customer buys one item for delivery to the same fictional US destination, without a membership or personal coupon. The stores, products, amounts, conditions and observation dates below are invented solely to explain the method.
02. Build a defensible comparison group
Include sellers your customer could realistically choose instead of you. A direct competitor offers the same product or a close substitute. An indirect competitor meets the underlying need differently. A secondhand marketplace can matter commercially without providing a like-for-like price for a new garment.
Our fictional retailers A, B and C sell identical references from the fictional brand Example Thread: T-shirt T01, cotton, medium, navy; and sweatshirt S01, cotton, medium, gray. A different fabric, fit, brand or multipack belongs in a separate value comparison unless you can justify equivalence.
This is a deliberately small comparison group, not a representative market sample. A seller's public prices do not reveal its purchasing costs, margins or service quality. Record missing evidence rather than filling gaps with a score that looks authoritative.
03. Keep the raw offer separate from the comparable price
Use one row per product, seller and purchase scenario. Keep list price, eligible discount and shipping in separate columns so another person can reconstruct the calculation. For real observations, retain the source, date, conditions and verification status. A blank field is not zero.
Example convention: USD, new items in stock, one unit per order, the same destination and no other mandatory fees in the fictional scenario. C's 20% promotion is public and immediate, with no minimum spend. Delivery speed and return terms are assumed equal to isolate price; verify them in a real analysis. Sales tax is excluded consistently, so these are not final checkout totals.
On small screens, scroll the table horizontally. Keyboard users can focus the table region and use the arrow keys.
| Seller | Product / variant | Displayed price | Eligible promotion | Shipping | Comparable pre-tax price | Fictional date |
|---|---|---|---|---|---|---|
| Example Apparel | T01 — T-shirt, cotton, M, navy | $30 | None | $5 | $35 | 2026-09-01 |
| A | T01 — T-shirt, cotton, M, navy | $28 | None | $8 | $36 | 2026-09-01 |
| B | T01 — T-shirt, cotton, M, navy | $32 | None | $0 | $32 | 2026-09-01 |
| C | T01 — T-shirt, cotton, M, navy | $35 | 20% off, public, no minimum | $6 | $34 | 2026-09-01 |
| Example Apparel | S01 — Sweatshirt, cotton, M, gray | $60 | None | $5 | $65 | 2026-09-01 |
| A | S01 — Sweatshirt, cotton, M, gray | $58 | None | $8 | $66 | 2026-09-01 |
| B | S01 — Sweatshirt, cotton, M, gray | $64 | None | $0 | $64 | 2026-09-01 |
| C | S01 — Sweatshirt, cotton, M, gray | $70 | 20% off, public, no minimum | $6 | $62 | 2026-09-01 |
The fictional observation date is September 1, 2026. Shipping is calculated for one item in one order. Do not add these totals together to describe a two-item basket: shared shipping, thresholds and discounts need to be recalculated at the order level.
Normalize only what you can justify
For this example: comparable pre-tax price = displayed price − eligible discount + shipping + other known mandatory fees. C's T-shirt is $35 × (1 − 20%) + $6 = $34 before tax. A members-only offer would not qualify for this customer scenario; analyze it separately if members are your intended audience.
If tax treatment, destination charges or mandatory conditions are unknown, flag the row for verification rather than ranking it as a known final cost. An annual subscription shown as a monthly equivalent still carries its commitment. Normalization makes differences explicit; it should not erase them.
04. Calculate gaps for each item
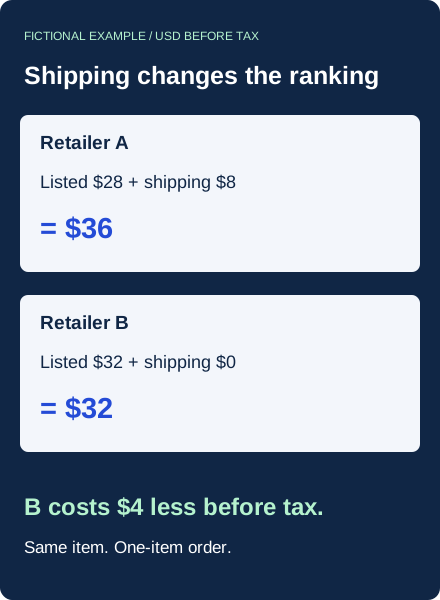
A's T-shirt has a $28 displayed price, below B's $32. After shipping, A reaches $36 while B stays at $32 before tax. A is therefore $4 more expensive on the chosen basis. The lowest product price does not produce the lowest comparable delivered amount.
Name the reference before quoting a percentage
We use the median of the three competitors: the middle value after sorting. It describes this sample, not an established market-wide price. The T-shirt totals are $32, $34 and $36, giving a median of $34. The sweatshirt totals are $62, $64 and $66, giving a median of $64.
CHECK THE ARITHMETIC
Relative gap = (our comparable price − competitor median) ÷ competitor median × 100.
T-shirt: (35 − 34) ÷ 34 × 100 ≈ +2.94%.
Sweatshirt: (65 − 64) ÷ 64 × 100 ≈ +1.56%.
A positive sign means our offer is above that reference. Keep the denominator consistent: dividing by our own price instead would answer a different question. Round at the end and retain the dollar gap too. Both items have a $1 difference from the median, but different percentage gaps.
Do not average these percentages and call the result the store's overall price disadvantage. An unweighted average treats both products as equally important. A basket index needs explicit quantities, order-level shipping calculations and a stated weighting method. It also needs coverage good enough to support the conclusion you intend to draw.
KEEP YOUR PRICE EVIDENCE CURRENT
Know when a page behind your analysis changes
Refreshing this table means revisiting product pages and checking whether prices or offers have changed. ChangeWatch can detect changes on compatible pages and send email alerts, so you can review the evidence and update your calculations. Start by checking the pages that matter to your comparison.
Check my competitor pagesHave three URLs ready for the form. Price normalization, metrics and decisions remain your work.
05. Separate the observation from the explanation
Observation: our comparable delivered price is $1 above the competitor median on both items. B is cheapest for the T-shirt; C is cheapest for the sweatshirt. No retailer is cheapest on every item in this dataset.
Hypothesis: the gap might contribute to some customers leaving without buying. The table does not prove that. It contains no visitor behavior, purchase reasons or measured response to delivery speed. A conversion change could have other causes.
Proportionate conclusion: there is a delivered-price gap worth examining for these two items, this purchase scenario and this fictional date. The data does not establish a revenue loss, a lasting competitor strategy or a requirement to lower our prices.
A useful next question is whether shoppers understand the delivered amount early enough. They might value a delivery promise, return experience or another feature more than the difference. Customer feedback and internal data can help test that explanation; they should not be invented to complete the spreadsheet.
06. Write a decision brief with a validation step
Possible responses include keeping the price and clarifying the offer, testing a limited change or collecting missing evidence first. Each proposal needs a reason, an owner and a way to judge its result. A pricing comparison should support a decision rather than mechanically trigger a discount.
- Proposed action: display the T-shirt's delivered pre-tax amount earlier, while retaining the current price initially.
- Reason: shipping changes the competitor ranking, so the product price alone describes the offer poorly.
- Validation: check understanding with customers and observe outcomes over a defined period, recording other changes that occur at the same time.
- Guardrail: before any later price test, calculate contribution using your actual revenue and variable costs on a consistent tax basis. A competitor's selling price does not reveal your margin.
A before-and-after comparison alone does not establish causality. Traffic mix, promotions or stock availability can change the outcome. Keep alternative explanations in the brief, along with a stopping rule or a date for reassessment.
MAKE THE ANALYSIS YOUR OWN
A blank template that follows the method
The CSV includes the purchase scenario, product attributes, price components, comparison reference, gaps, observation, hypothesis and action. Use one row per item and retailer. Enter calculations using the formulas above; there are no macros or external connections.
Download the CSV templateAn editorial worksheet to complete in your spreadsheet. It is not a ChangeWatch data-export or automated analysis feature.
Turn a price table into a defensible conclusion
A useful analysis states the question, sample and conventions, shows its arithmetic and distinguishes evidence from unresolved explanations. The decision brief can legitimately recommend further investigation before any pricing change.
KEY TAKEAWAYS
In this fictional dataset, shipping reverses the T-shirt ranking and our price is $1 above the median for each item. Those are bounded observations. Explaining customer choices and evaluating an intervention require additional evidence.
Refreshing this analysis requires checking the product pages and offers behind it. Our ecommerce competitor monitoring guide explains how to organize that work. ChangeWatch detects changes on compatible pages and sends email alerts; it does not automatically create this table, calculate its metrics, export your analysis or change your selling prices.
FROM ANALYSIS TO ONGOING MONITORING
Keep track of the pages behind your pricing decisions
Ask us to check three URLs, then choose a plan for the compatible pages you need to follow. Starter costs €14.90/month for 5 URLs, checked once a day, with setup included. Business and Pro support a wider monitoring scope. Subscription prices are in euros, unlike the fictional USD example above.
For businesses. The pre-subscription enquiry is optional, but helps establish compatibility. Monitoring is not real-time or exhaustive; pagination and extraction limits may affect the information available.
Comments
Have a question, feedback or experience to share?